本篇文章由 VeriMake 旧版论坛中备份出的原帖的 Markdown 源码生成
原帖标题为:Python COVID-19 数据可视化案例
原帖作者为:YX(旧版论坛 id = 71)
原帖由作者初次发表于 2020-04-13 15:34:18
原文:Visualizing COVID-19 Data Beautifully in Python (in 5 Minutes or Less!!)
本文根据原文改写,重点关注代码解析。感谢原文作者的工作与分享!
Section 1 - Download Data
在notebook中输入如下命令,即可下载数据,并在当前工作目录下保存为countries-aggregated.csv
!curl -o countries-aggregated.csv https://raw.githubusercontent.com/datasets/covid-19/master/data/countries-aggregated.csv
Section 2 - Loading and Selecting Data
import pandas as pd
import matplotlib.pyplot as plt
from matplotlib.dates import DateFormatter
import matplotlib.ticker as ticker
%matplotlib inline
# parse_dates :将csv中的时间字符串转换成日期格式
df = pd.read_csv('countries-aggregated.csv', parse_dates=['Date'])
# 查看国家
df['Country'].unique()
这份数据包含很多国家
array(['Afghanistan', 'Albania', 'Algeria', 'Andorra', 'Angola',
'Antigua and Barbuda', 'Argentina', 'Armenia', 'Australia',
'Austria', 'Azerbaijan', 'Bahamas', 'Bahrain', 'Bangladesh',
'Barbados', 'Belarus', 'Belgium', 'Belize', 'Benin', 'Bhutan',
'Bolivia', 'Bosnia and Herzegovina', 'Botswana', 'Brazil',
'Brunei', 'Bulgaria', 'Burkina Faso', 'Burma', 'Burundi',
'Cabo Verde', 'Cambodia', 'Cameroon', 'Canada', ...
我们选取6个国家的数据做可视化
countries = ['Canada', 'Germany', 'United Kingdom', 'US', 'France', 'China']
# 掩码取值,选取countries内包含的6个国家,也可以添加,此时只要调整countries这个list即可
df = df[df['Country'].isin(countries)]
Section 3 - Creating a Summary Column
# Cases = Confirmed + Recovered + Deaths (axis=1)
df['Cases'] = df[['Confirmed', 'Recovered', 'Deaths']].sum(axis=1)
Section 4 - Restructuring our Data
# 制作透视表
df = df.pivot(index='Date', columns='Country', values='Cases')
covid = df
Section 5 - Calculating Rates per 100,000
populations = {'Canada':37664517, 'Germany': 83721496 , 'United Kingdom': 67802690 , 'US': 330548815, 'France': 65239883, 'China':1438027228}
# 根据covid进行浅拷贝,创建新的对象,但是这个新对象对旧对象中的子对象并没有重新创建
# 具体参考附录文献[1]
percapita = covid.copy()
for country in list(percapita.columns):
    percapita[country] = percapita[country]/populations[country]*100000
Section 6 - Generating Colours and Style
colors = {'Canada':'#045275', 'China':'#089099', 'France':'#7CCBA2', 'Germany':'#FCDE9C', 'US':'#DC3977', 'United Kingdom':'#7C1D6F'}
# 配置plot的风格,具体见[2]
plt.style.use('fivethirtyeight')
Section 7 - Creating the Visualization
# 核心绘图语句,设置图片大小、线条颜色、线宽、是否需要图例。
# figsize可自行配置
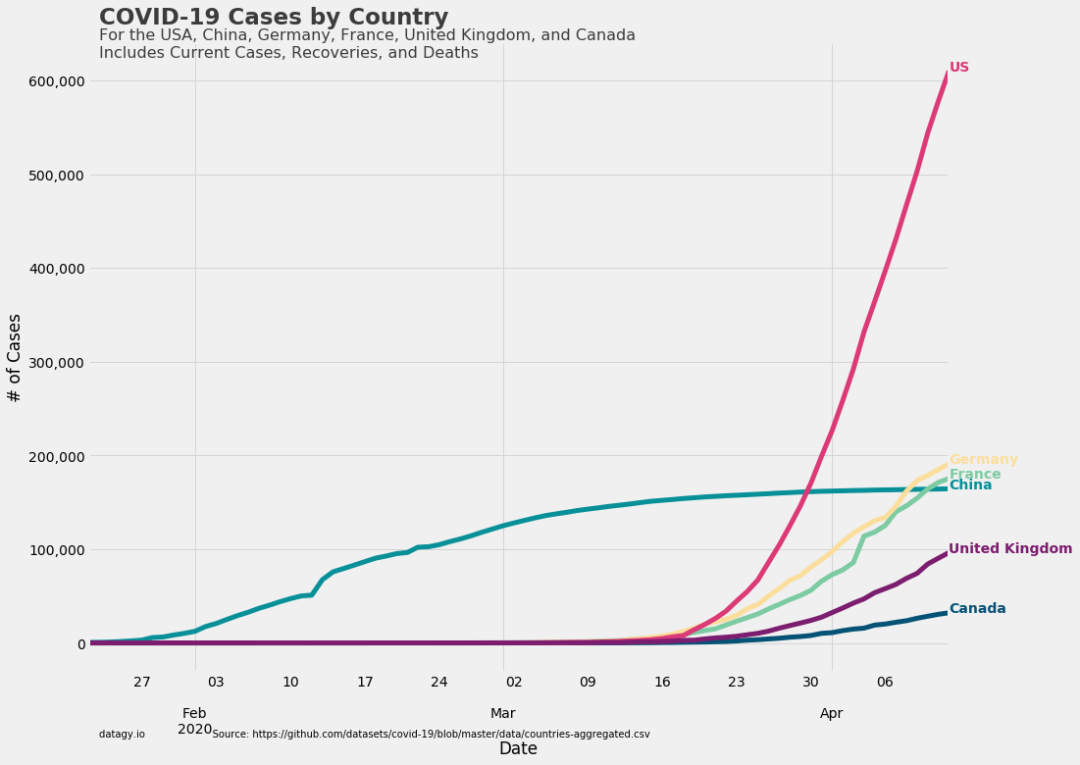
plot = covid.plot(figsize=(14,11), color=list(colors.values()), linewidth=5, legend=False)
# ticker.StrMethodFormatter 的配置见下文详细解释[3]
# set_major_formatterd 的使用介绍见[4]
# 此处配置y轴的刻度格式
plot.yaxis.set_major_formatter(ticker.StrMethodFormatter('{x:,.0f}'))
# 此处配置网格
plot.grid(color='#d4d4d4')
plot.set_xlabel('Date')
plot.set_ylabel('# of Cases')
Section 8 - Assigning Colour
# x, y为坐标,s为text内容,输出为图片右侧的国家名称
for country in list(colors.keys()):
    plot.text(x = covid.index[-1], y = covid[country].max(), color = colors[country], s = country, weight = 'bold')
Section 9 - Adding Labels
# x,y为文字的坐标,s为文字内容
# covid.max() 取的是每个国家的最大值,是一列数据,covid.max().max()取的是所有国家中的最大值,
# 是一个数据,这个数据表示线条的最高点,加上一个偏移量比如50000,就可用来设置文字内容y轴高度
# 这个偏移量与图片大小有关,比如这里设置成了50000,而不是原文中的数字
plot.text(x = covid.index[1], y = int(covid.max().max())+50000, s = "COVID-19 Cases by Country", fontsize = 23, weight = 'bold', alpha = .75)
plot.text(x = covid.index[1], y = int(covid.max().max())+15000, s = "For the USA, China, Germany, France, United Kingdom, and Canada\nIncludes Current Cases, Recoveries, and Deaths", fontsize = 16, alpha = .75)
plot.text(x = percapita.index[1], y = -100000,s = 'datagy.io                      Source: https://github.com/datasets/covid-19/blob/master/data/countries-aggregated.csv', fontsize = 10)

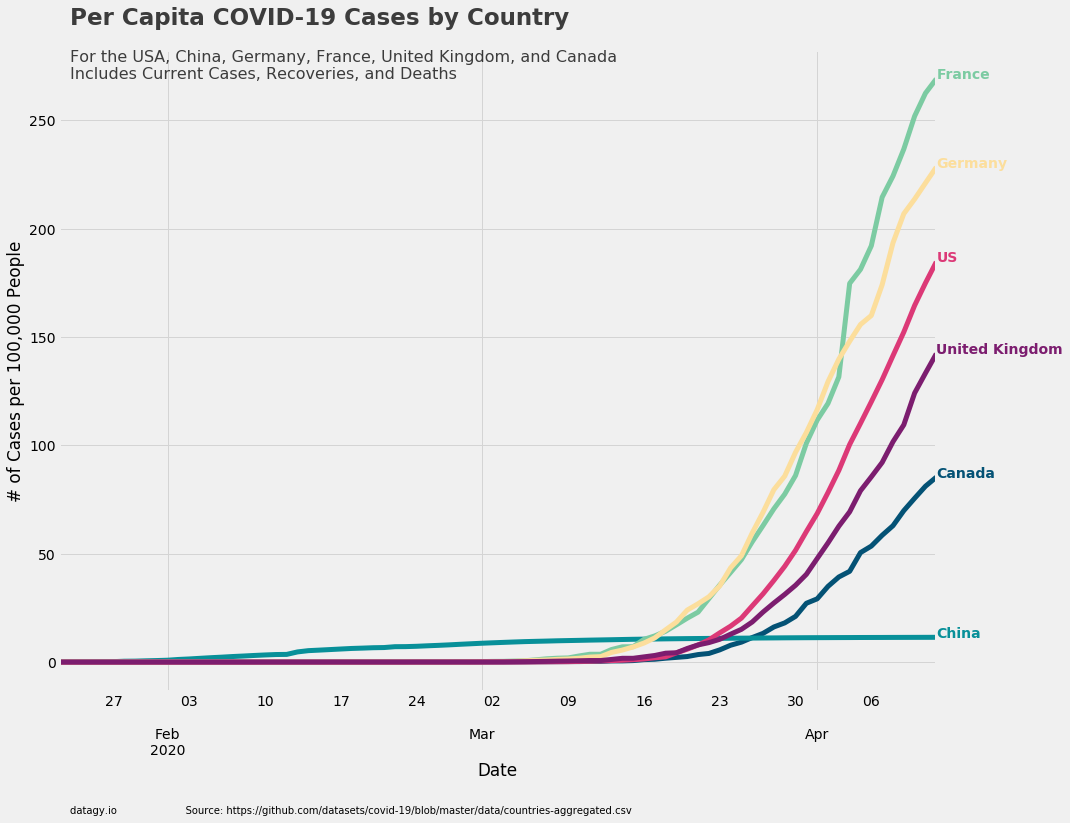
Cases per 100,000 People
percapitaplot = percapita.plot(figsize=(12,8), color=list(colors.values()), linewidth=5, legend=False)
percapitaplot.grid(color='#d4d4d4')
percapitaplot.set_xlabel('Date')
percapitaplot.set_ylabel('# of Cases per 100,000 People')
for country in list(colors.keys()):
    percapitaplot.text(x = percapita.index[-1], y = percapita[country].max(), color = colors[country], s = country, weight = 'bold')
percapitaplot.text(x = percapita.index[1], y = percapita.max().max()+25, s = "Per Capita COVID-19 Cases by Country", fontsize = 23, weight = 'bold', alpha = .75)
percapitaplot.text(x = percapita.index[1], y = percapita.max().max(), s = "For the USA, China, Germany, France, United Kingdom, and Canada\nIncludes Current Cases, Recoveries, and Deaths", fontsize = 16, alpha = .75)
percapitaplot.text(x = percapita.index[1], y = -70,s = 'datagy.io                      Source: https://github.com/datasets/covid-19/blob/master/data/countries-aggregated.csv', fontsize = 10)

附录:
[1] pandas 中的等号'='和copy()
[2] Python plot() 绘图的风格选择, 字体选择等
[3] ticker.StrMethodFormatter
The field used for the value must be labeled x and the field used for the position must be labeled pos.
[4] Matplotlib绘图双纵坐标轴设置及控制设置时间格式
 网站备案号:ICP备16046599号-1