本篇文章由 VeriMake 旧版论坛中备份出的原帖的 Markdown 源码生成
原帖标题为:Python Implementation on "Storytelling with Data"——Figure 2.4
原帖网址为:https://verimake.com/topics/160 (旧版论坛网址,已失效)
原帖作者为:Felix(旧版论坛 id = 28,注册于 2020-04-18 19:59:47)
原帖由作者初次发表于 2020-09-20 17:57:48,最后编辑于 2020-09-20 17:57:48(编辑时间可能不准确)
截至 2021-12-18 14:27:30 备份数据库时,原帖已获得 1340 次浏览、1 个点赞、0 条回复
Introduction
This text introduces how to use Python to draw tables.
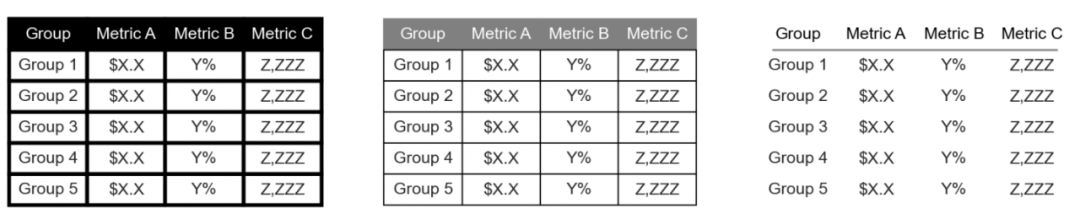
Sometimes table with light background color and solid text color could draw readers' attention more on data and more clearly emphasize the points.
Import modules
import pandas as pd
import numpy as np
import matplotlib as mpl
import matplotlib.pyplot as plt
import matplotlib.patches as mpathes
Set style
plt.style.use('seaborn-whitegrid')
Import data
data = pd.read_csv('D:/programming/dataset/storytellingwithdata/project/data2.4.csv')
Data preview
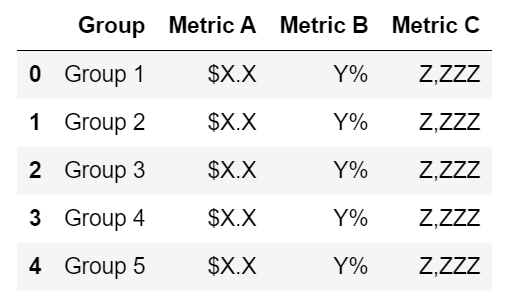
Data preprocessing
# Change all rows and columns to lists.
row1 = data.loc[0].values.tolist()
row2 = data.loc[1].values.tolist()
row3 = data.loc[2].values.tolist()
row4 = data.loc[3].values.tolist()
row5 = data.loc[4].values.tolist()
columns = data.columns.tolist()
Draw tables
Define a format_table() function
def format_table(table, i, row, col, color_1, color_2, linewidth):
    """Draw a table in a subplot with specified row, column, cell background color, text 	 color, and linewidth."""

    table_cells = table.get_celld()
    table.set_fontsize(15)

    # [1]
    for _col_ in range(0, col):
        # Set background color and text color of the column titles.
        table_cells[0, _col_].set_color(color_1)
        table_cells[0, _col_].get_text().set_color(color_2)
        for _row_ in range(0, row):
            # Set cells' height and linewidth.
            table_cells[(_row_, _col_)].set_height(.15)
            table_cells[(_row_, _col_)].set_linewidth(linewidth)

    ax[i].axis('off')
Show tables and formatting
# Define constants.
ROW: int = 6
COL: int = 4
LINEWIDTH_1: int = 3
LINEWIDTH_2: int = 1
LINEWIDTH_3: int = 0
LINE_HEIGHT: int = 83

# Create 3 subplots (1 * 3).
fig, ax = plt.subplots(1, 3, figsize=(15, 3), dpi=150)

# Put data in and return 3 tables.
table_1 = ax[0].table([columns,row1,row2,row3,row4,row5], cellLoc='center', loc=9)
table_2 = ax[1].table([columns,row1,row2,row3,row4,row5], cellLoc='center', loc=9)
table_3 = ax[2].table([columns,row1,row2,row3,row4,row5], cellLoc='center', loc=9)

# Format 3 tables by function defined.
# black background and white text
format_table(table_1, 0, ROW, COL, 'black', 'white', LINEWIDTH_1)
# grey background and white text
format_table(table_2, 1, ROW, COL, 'grey', 'white', LINEWIDTH_2)
# white background and black text
foramt_table(table_3, 2, ROW, COL, 'white', 'black', LINEWIDTH_3)

# Set boundries in the third subplot.
# invisible line: y = 100
x = np.arange(0, 5, 0.01)
y = np.ones(len(x))
y = y * 100
ax[2].plot(x, y, c='white')
# invisible line: y = 0
x = np.arange(0, 5, 0.01)
y = np.ones(len(x))
y = y * 0
ax[2].plot(x, y, c='white')

# Draw the line in the third subplot.
# visible black line: y = LINE_HEIGHT
x = np.arange(-1, 10, 0.01)
y = np.ones(len(x))
y = y * LINE_HEIGHT
ax[2].plot(x, y, c='grey')

plt.show()
Result
References
[1] how-to-set-background-color-of-a-column-in-a-matplotlib-table
 网站备案号:ICP备16046599号-1